October 2025

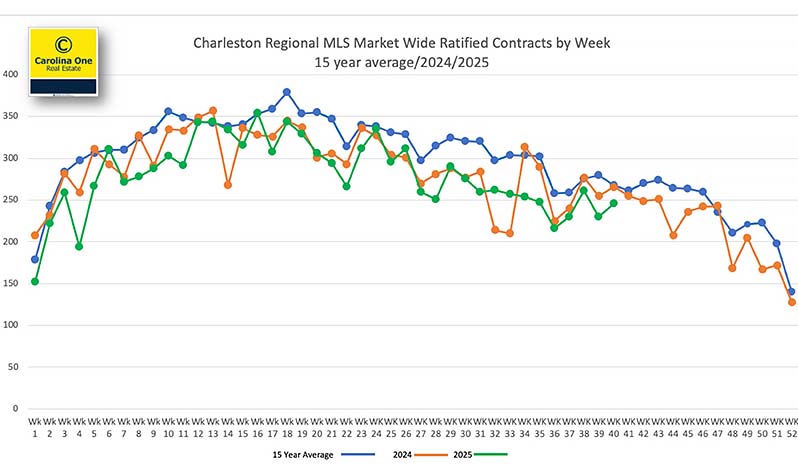
For the week of October 13 – 19, 2025) written sales jumped to 261 ratified contracts across the Charleston MLS – well above the ~200 and ~240 in the two prior weeks. August closed sales were essentially flat year over year (+1%), while August written sales finished a modest −2% versus August 2024. We’re easing into the normal fall slowdown, but opportunity remains abundant: with ~4,000+ sales still expected in 2025, there are thousands of chances to help clients make a move.

Why This Matters Now
Fall in Charleston reliably brings a gradual step‑down from the spring/early‑summer frenzy. That’s normal – and it’s not a signal that you “missed it.” It simply means pace cools while motivated buyers and sellers keep transacting. Ratified contracts (“pendings”) are the best real‑time read on buyer sentiment today and a preview of closings 5 – 8 weeks from now.

Follow the green line. In our weekly contracts chart, the green line is 2025, orange is 2024, and blue is the 15‑year weekly average.

Download Chart as a pdf.

Market Pulse (at a glance)

  • 261 ratified contracts (week of Oct 13–19), outpacing the two prior weeks (~200, ~240).
  • August 2025 closed sales: +1% YoY vs. August 2024.
  • August 2025 written sales: −2% YoY vs. August 2024.
  • Seasonality: We are moving deeper into the typical fall slowdown – still active, just less frenzied than spring.

Mortgage Rates: Lowest of 2025… with Mild Upward Pressure

Mortgage rates recently touched their lowest point of the year, with a bit of current upward pressure. For buyers waiting on rates, the math favors acting when the right home appears:

  • If rates go down after closing → refinance.
  • If rates stay the same → you’re no worse off.
  • If rates go up → you’ll be glad you bought.

Download Chart as a pdf.

Prices & Value

  • Median Sale Price: Holding just under $425,000, near an all‑time high. For ~3 years, median has lived in a tight $400k–$425k band; the small upward drift over the last 7 months suggests continued pricing resilience.

Download Chart as a pdf.

Graph 3 - Median Sales

Prices & Value

  • Average Sold $/SqFt: Within 1% of an all‑time high in August.
    Interpretation: Consumers may be approaching their monthly payment ceiling (stable median price), but are buying slightly smaller homes for the same budget (higher $/sqft). Net effect: gradual appreciation even with a flat median.

Download Chart as a pdf.

Supply & Demand

  • Active Inventory (mid‑August): ~5,200 listings – well above the 1,035 low from Feb 2022, yet still short of balance.
  • To reach balance (~5 months of supply): We need roughly +2,600 more listings market‑wide.

Download Chart as a pdf.

Graph 5 Inv-vs-Need

Supply, Demand

  • New Listings (August): ~2,200, up ~11% YoY

Download Chart as a pdf.

Graph 6 Listings Taken

Months of Inventory

  • Months of Inventory: About 12 weeks (~3 months) across the market, still a seller’s market overall (varies by price band and sub‑market). Most active pockets are in the 8–12 week range.

Download Chart as a pdf.

Graph 8 Absorption